Scoreboard
8 UI libraries built the same /tickets screen against one spec. Every figure here is read from results/ in the repo. There is no overall score and no winner; the write-up picks per situation.
| Screen | Library | Delta, gzip | Total, against the 180 KB budget | Criteria passed | axe violations before fixes | Requirements needing custom code | Median first render |
|---|---|---|---|---|---|---|---|
| React, 5 builds | |||||||
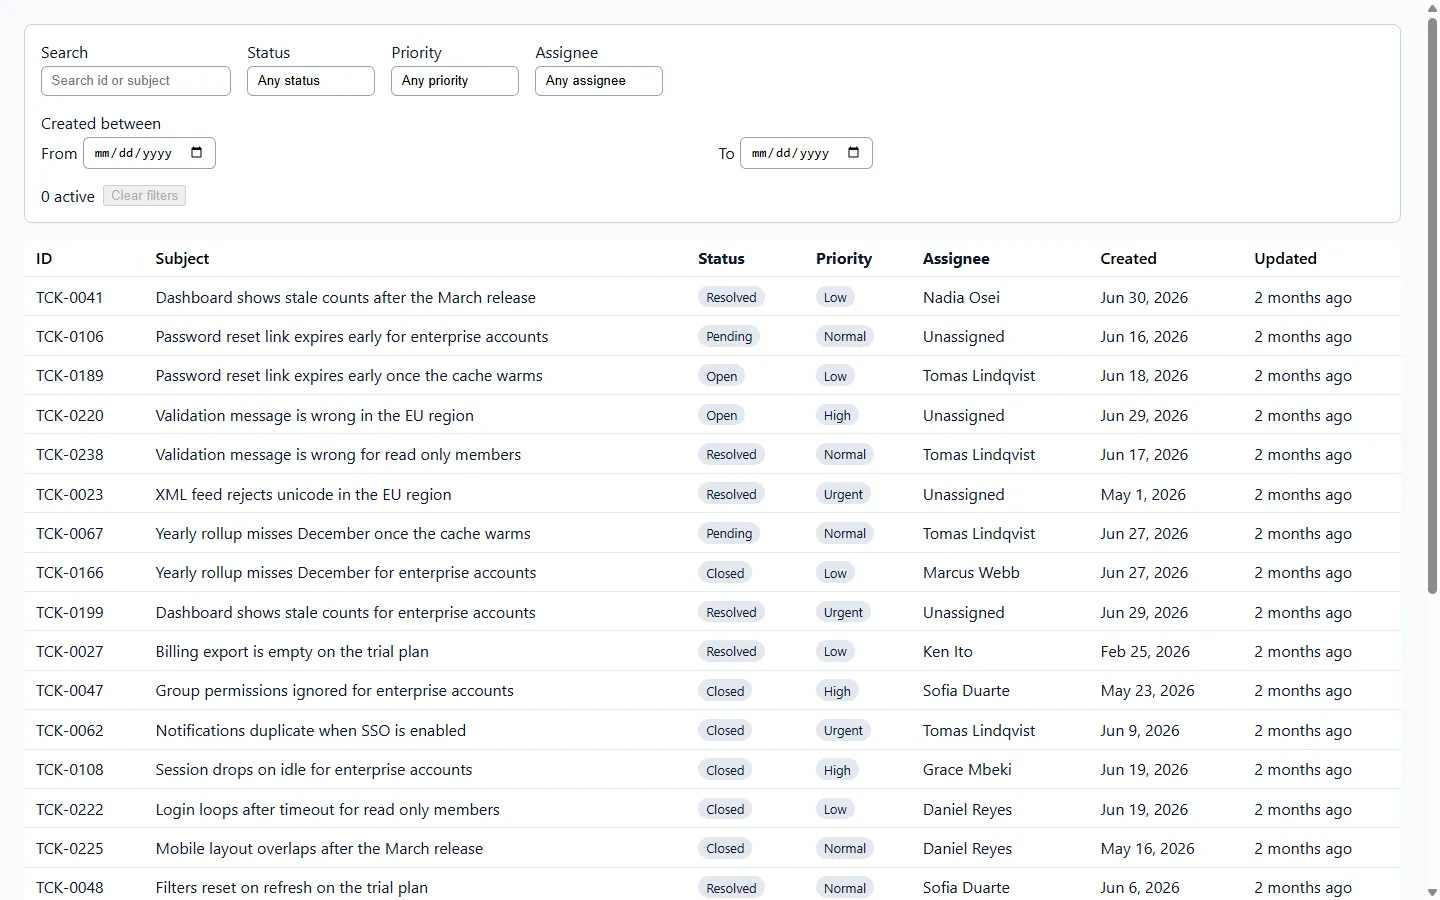 , open the live screen , open the live screen | Headless UIreact-headlessassembly kit | 44.90 KB | 89.81 KB within budget | 18 of 18 | 0 | 6 | 1378 ms* |
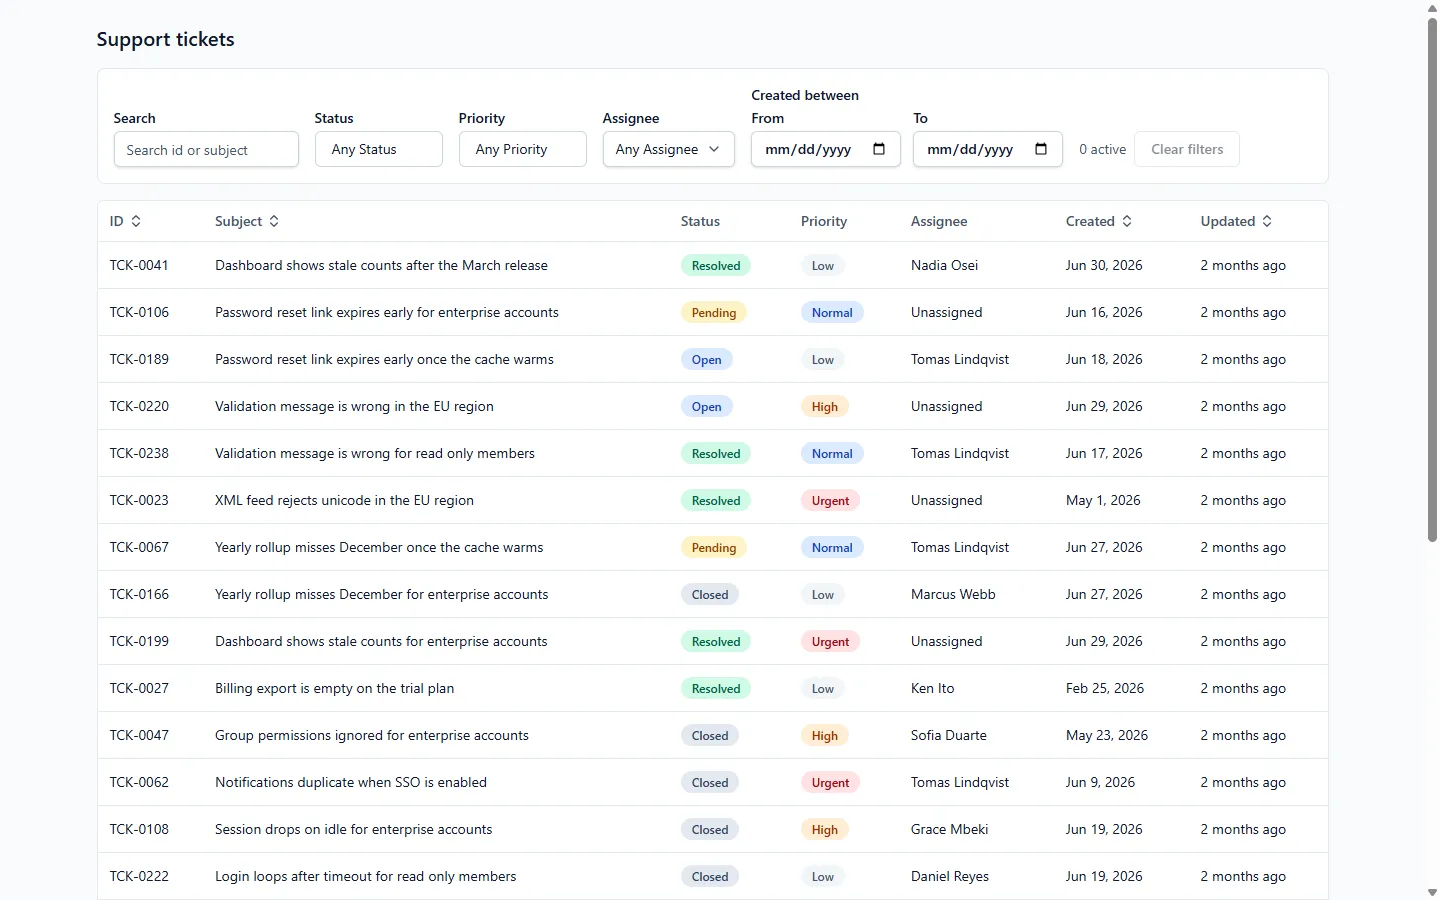 , open the live screen , open the live screen | shadcn/uireact-shadcnassembly kit | 58.89 KB | 103.80 KB within budget | 18 of 18 | 0 | 4 | 1390 ms* |
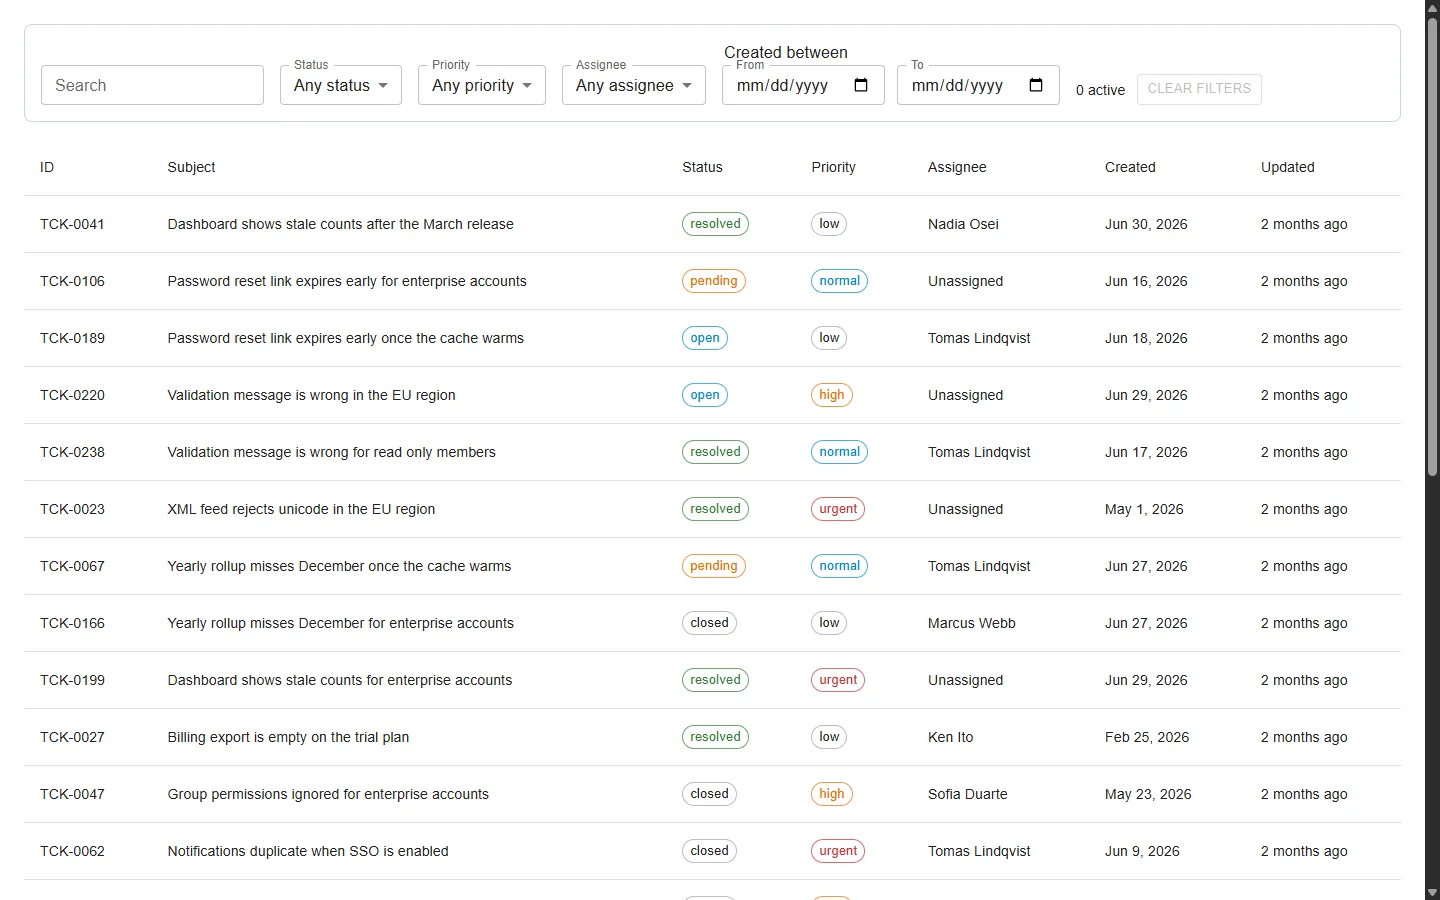 , open the live screen , open the live screen | Material UIreact-muisuite | 79.76 KB | 124.67 KB within budget | 18 of 18 | 0 | 3 | 1526 ms* |
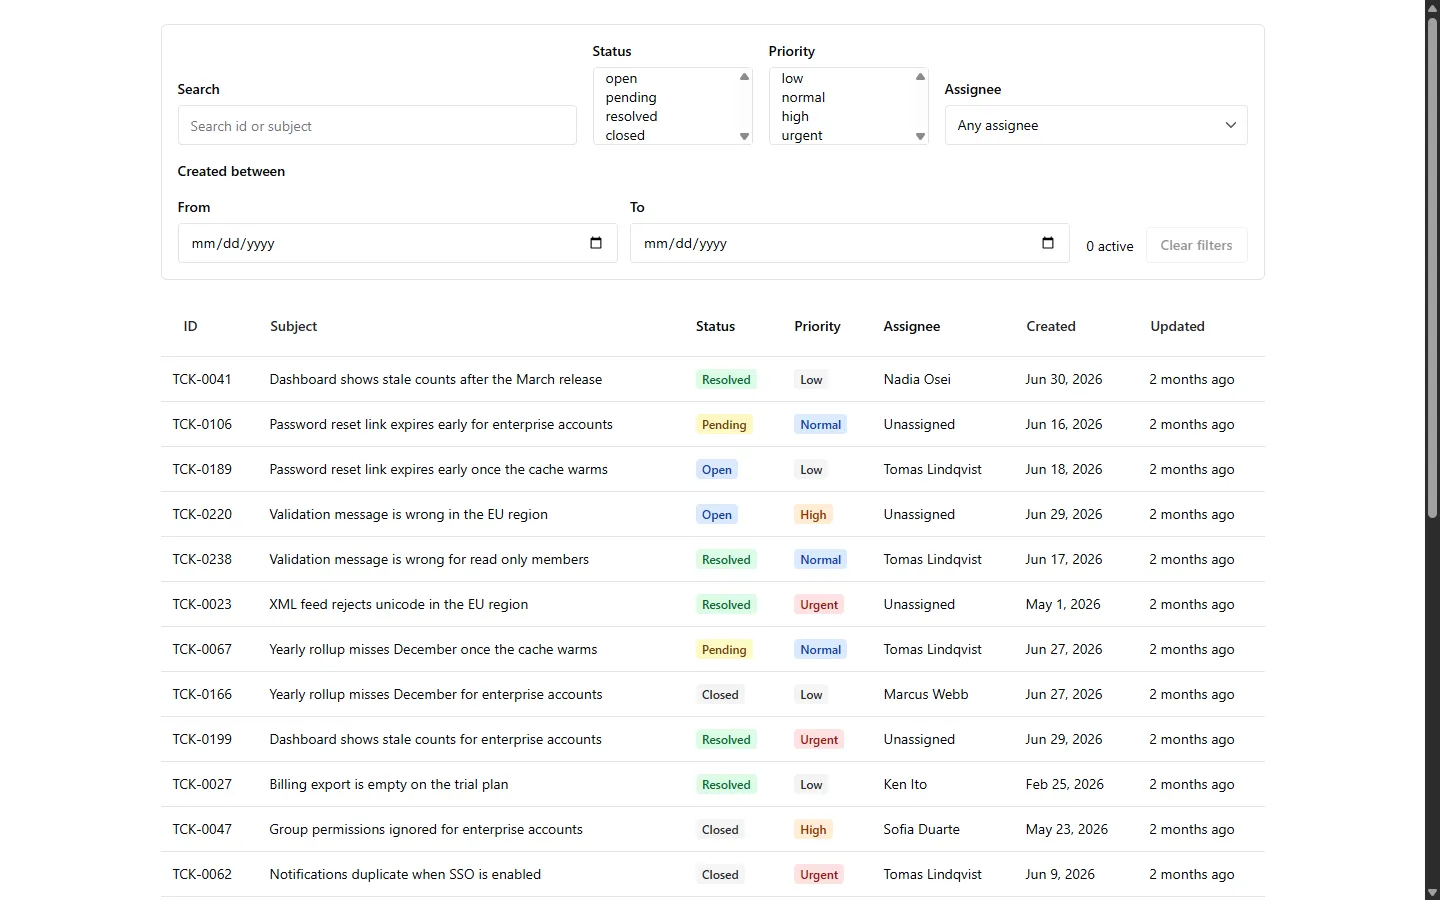 , open the live screen , open the live screen | Chakra UIreact-chakrasuite | 97.81 KB | 142.72 KB within budget | 18 of 18 | 0 | 4 | 1653 ms* |
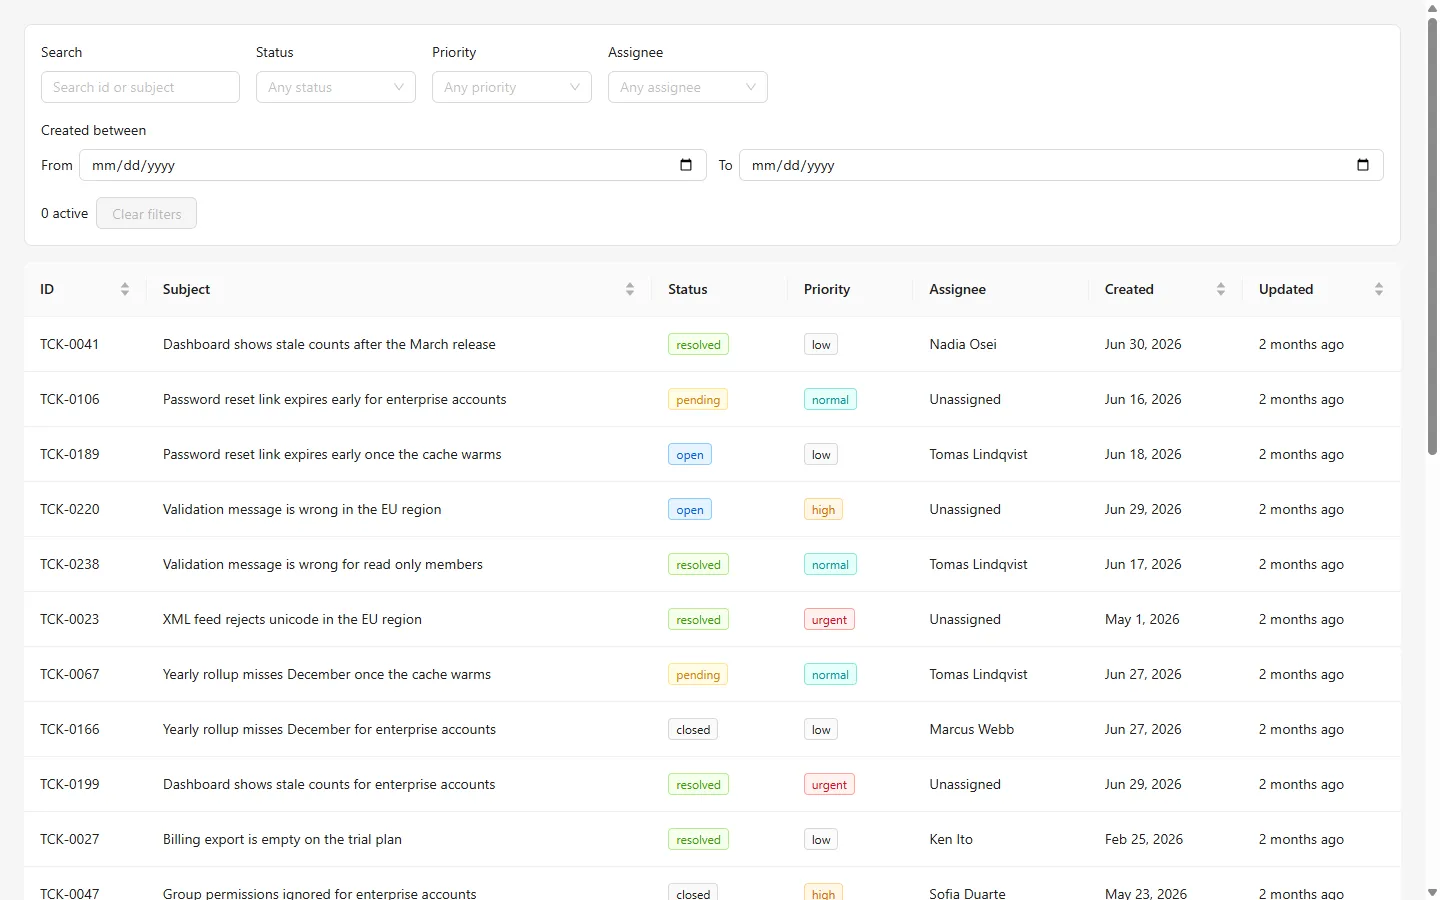 , open the live screen , open the live screen | Ant Designreact-antdsuite | 233.87 KB | 278.78 KB Over budget by 98.78 KB | 18 of 18 | 0 | 5 | 2277 ms* |
| Vue, 3 builds | |||||||
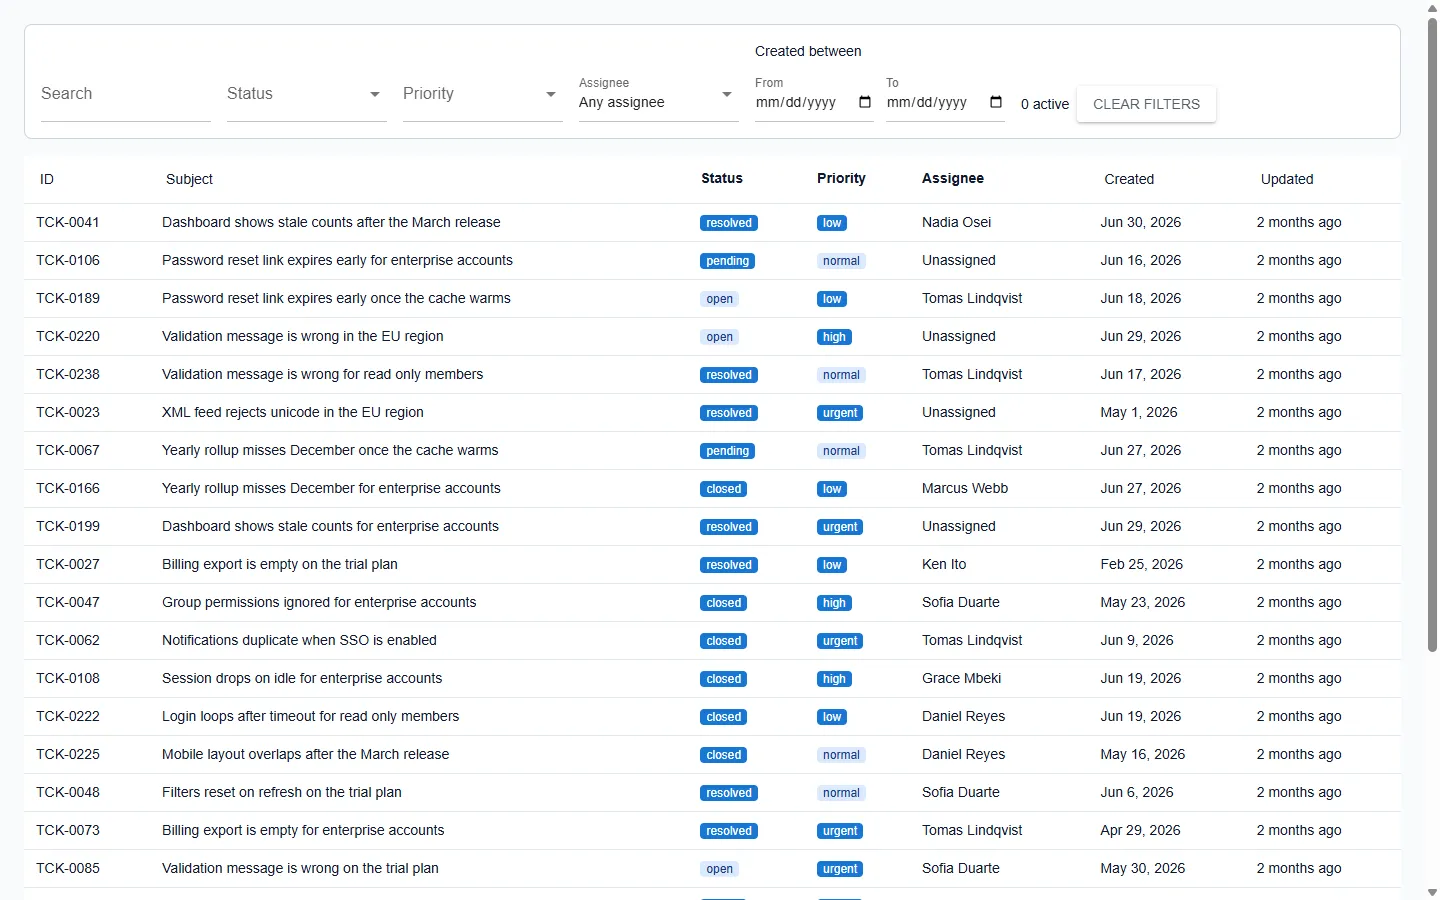 , open the live screen , open the live screen | Quasarvue-quasarsuite | 91.71 KB | 115.92 KB within budget | 18 of 18 | 1 | 6 | 1565 ms* |
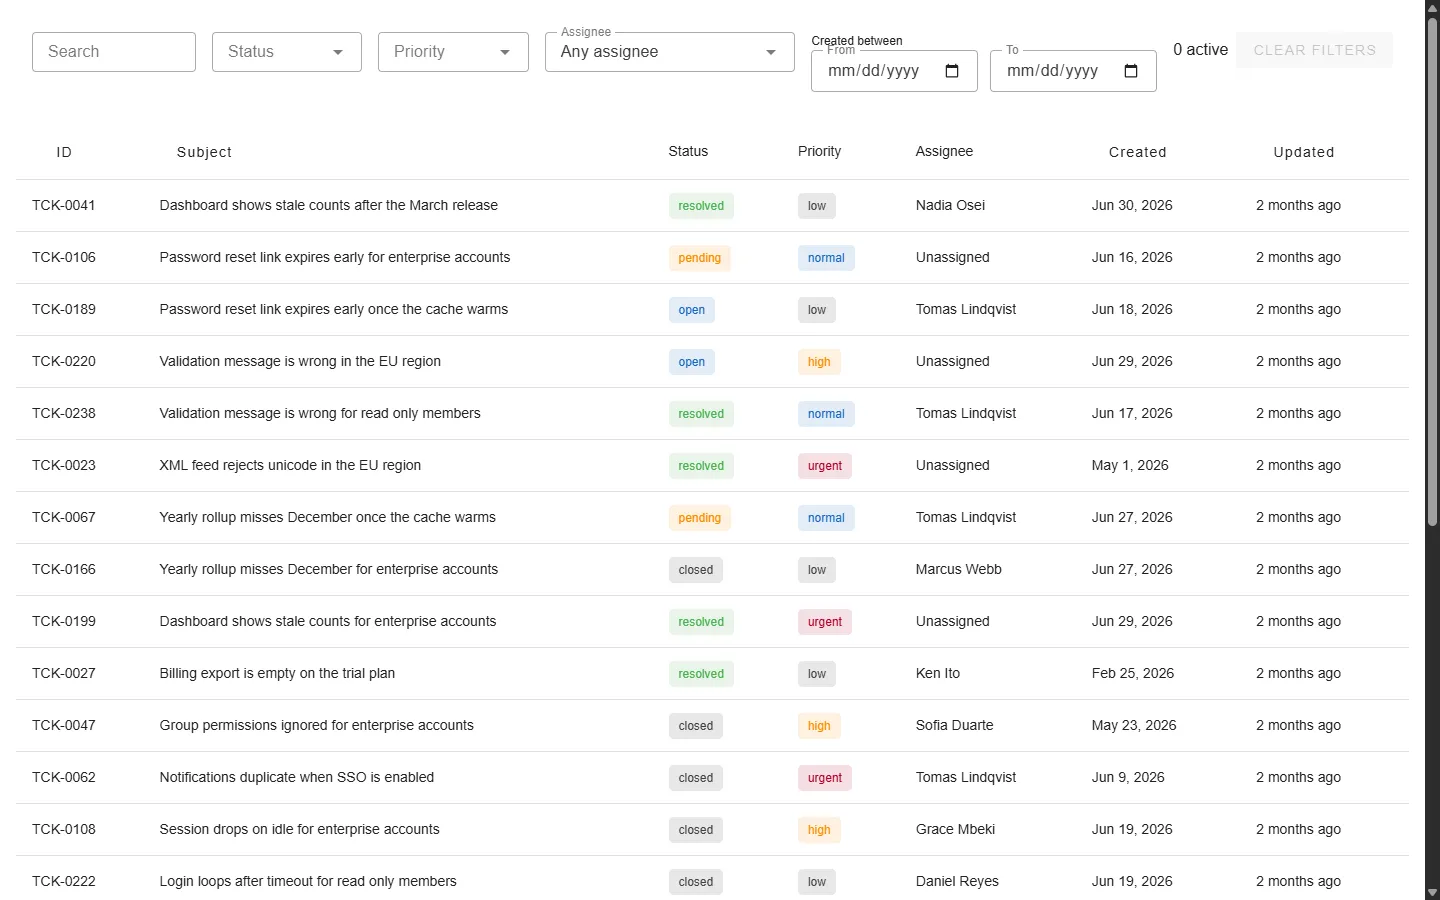 , open the live screen , open the live screen | Vuetifyvue-vuetifysuite | 128.87 KB | 153.08 KB within budget | 18 of 18 | 0 | 6 | 1741 ms* |
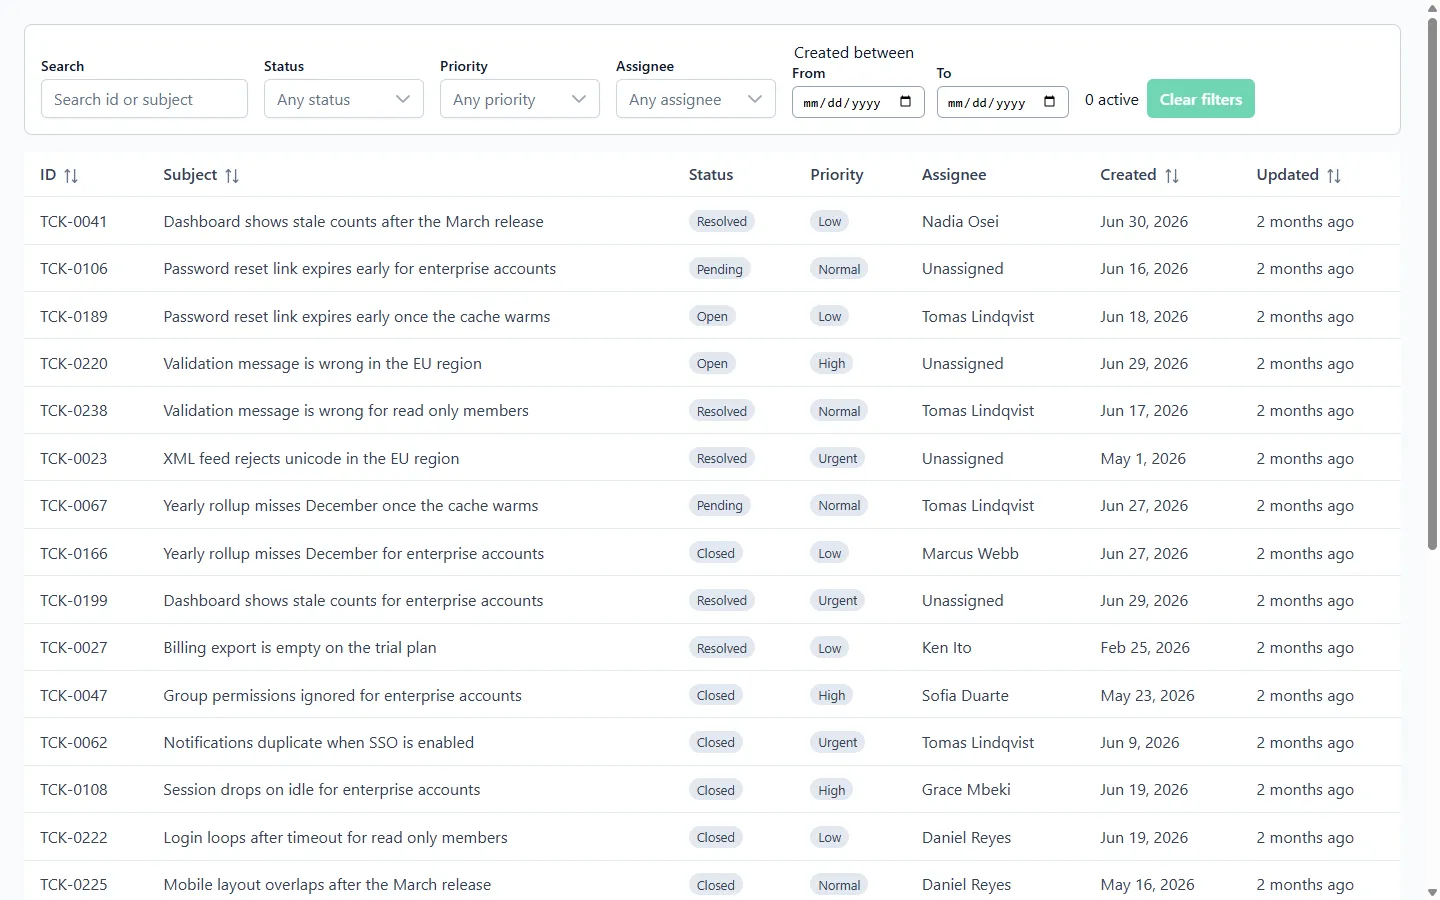 , open the live screen , open the live screen | PrimeVuevue-primevuesuite | 150.20 KB | 174.41 KB within budget | 18 of 18 | 0 | 4 | 1745 ms* |
* First render is the median of 5 Lighthouse runs, taken from one Windows machine against this deployed site on 2026-09-16. The figures are relative: Lighthouse throttles to a simulated mid-tier phone, and other hardware or networks would move the milliseconds.
A screenshot opens that build's live screen. A library name opens its detail view, with both screenshots at full size. Assembly kits ship fewer finished parts by design, so their hand built counts on the detail views read as the trade they make.
The four categories as bars
Each bar is one build against the other seven on a shared scale, with the figure printed beside it. Color marks the framework and nothing else. React and Vue stay in separate groups, each ordered by delta.
- React
- Vue
- Lighter bar behind: total
- Vertical line: 180 KB budget
- Dashed outline: over budget